

A study ontesting thermal paper with Raman spectrometry
Raman Spectroscopy for the Analysis and Testing of Thermal Paper
Su Xiang¹, Zhang Hong¹, Chen Yutai¹, Zhang Liyuan², Fan Ye³
(¹ People’s Public Security University of China, Beijing 100038, China;
² Beijing Zhuoli Hanguang Instrument Co., Ltd., Beijing 101102, China;
³ Baiyun District Bureau, Guangzhou Public Security Bureau, Guangzhou 510000, China)
Abstract
Thermal paper is a type of recording paper that undergoes thermal coating and is activated by thermal energy to generate high-resolution text or images. With the advancement of society, thermal paper has been widely used as a recording medium for information transmission and is often collected from crime scenes. Currently, the primary techniques used for testing thermal paper include infrared spectroscopy, scanning electron microscopy/energy-dispersive spectroscopy, and high-performance liquid chromatography. Raman spectroscopy, due to its non-contact and non-destructive nature, short testing time, minimal sample preparation, and low sample consumption, has seen widespread use in the forensic field. Although handwriting on thermal paper tends to fade over time, the filler composition remains relatively stable and is less susceptible to external interference. Therefore, Raman spectroscopy can be effectively used to analyze the packaging material of thermal paper samples. In this experiment, thermal paper samples were tested and analyzed using Raman spectroscopy, and good experimental results were obtained.
1. Experiment
1.1 Experimental Equipment and Conditions
-
Instrument: “FinderVista” Confocal Laser Raman Microscope (Beijing Zhuoli Hanguang Instrument Co., Ltd.)
-
Laser Source: 785 nm wavelength
-
Laser Power: 20 mW
-
Scanning Mode: Point scanning
-
Grating: 600 g/mm
-
Resolution: 0.9 cm⁻¹
-
Signal Collection: 100× objective lens
-
Integration Time: 15 seconds
-
Number of Accumulations: 3
1.2 Experimental Samples
A total of 70 thermal paper samples were collected from various commonly available brands, including:
-
Online recharge vouchers for the Beijing Municipal Transportation Card,
-
Receipts from foreign bookstores,
-
Shopping receipts from Starbucks Parkson Store,
-
Shopping receipts from Beijing Hualian Xidan Joy City Store,
-
and other everyday thermal paper samples.
(*Note: See original text for sample details.)
1.3 Experimental Method
From each sample, an area of approximately 5 mm × 5 mm was cut using a scalpel. Raman spectroscopy was then performed on all 70 thermal paper samples under the aforementioned experimental conditions.
2. Results and Discussion
2.1 Raman Spectral Analysis of Common Fillers in Thermal Paper
In the manufacturing process of thermal paper, to enhance product performance and reduce production costs, manufacturers typically add different types and proportions of fillers depending on the process and application. The commonly used fillers in thermal paper include calcium carbonate, talc, kaolin, and silica.
The general Raman spectra of these packaging materials are shown in Figure 1, with their characteristic Raman peaks listed in Table 1. As a specialty paper, the primary component of thermal paper is cellulose. Therefore, only the Raman characteristic peaks of inorganic fillers are considered in the analysis.
The experimental results indicate:
-
Calcium carbonate: 154 cm⁻¹, 280 cm⁻¹, 712 cm⁻¹, 1086 cm⁻¹
-
Kaolin: 141 cm⁻¹, 636 cm⁻¹
-
Talc: 107 cm⁻¹, 192 cm⁻¹, 289 cm⁻¹, 360 cm⁻¹, 430 cm⁻¹, 465 cm⁻¹, 674 cm⁻¹, 1049 cm⁻¹, 1097 cm⁻¹
-
Silica: 127 cm⁻¹, 203 cm⁻¹, 263 cm⁻¹, 353 cm⁻¹, 401 cm⁻¹, 463 cm⁻¹
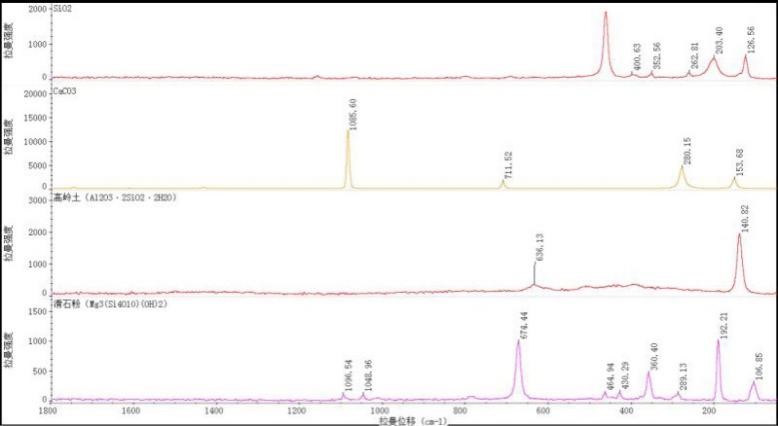
Figure 1: Raman characteristic peaks of commonly used fillers in thermal paper
Table 1: Raman peaks of commonly used fillers
| Filler Type | Raman Shift (cm⁻¹) |
|---|---|
| Calcium Carbonate | 154, 280, 712, 1086 |
| Kaolin | 141, 636 |
| Talc | 107, 192, 289, 360, 430, 465, 674, 1049, 1097 |
| Silica | 127, 203, 263, 353, 401, 463 |
2.2 Raman Spectroscopy for Thermal Paper Sample Analysis
By comparing the Raman spectra of thermal paper samples to those of known fillers, the filler components in each sample were identified. Based on the filler compositions, the 70 samples were classified into 14 categories:
-
Class 1: Kaolin, calcium carbonate, talc, and silica
-
Class 2: Calcium carbonate, talc, and silica
-
Class 3: Kaolin, talc, and silica
-
Class 4: Kaolin, calcium carbonate, and talc
-
Class 5: Kaolin, calcium carbonate, and silica
-
Class 6: Calcium carbonate and silica
-
Class 7: Calcium carbonate and talc
-
Class 8: Kaolin and silica
-
Class 9: Kaolin and talc
-
Class 10: Kaolin and calcium carbonate
-
Class 11: Talc only
-
Class 12: Calcium carbonate only
-
Class 13: Kaolin only
-
Class 14: No filler detected
For samples in the same category, further differentiation can be achieved based on relative peak height ratios. For instance, Class 12 (calcium carbonate only) includes 10 samples. These can be distinguished using the ratio of peak heights at 232 cm⁻¹ (h₁) and 369 cm⁻¹ (h₂).
From Table 2:
-
Sample #35 has an h₁/h₂ ratio >1, meaning the peak at 232 cm⁻¹ is higher than that at 369 cm⁻¹, making it easily distinguishable.
-
Samples #4 and #9 have ratios close to 0.5, meaning the 232 cm⁻¹ peak is about half the height of the 369 cm⁻¹ peak.
-
Other samples also show distinct variations in the h₁/h₂ ratio, enabling further identification.
Figure 2: Raman characteristic peaks of Class 12 samples
Table 2: Relative Peak Height Ratios (h₁/h₂) for Class 12 Samples
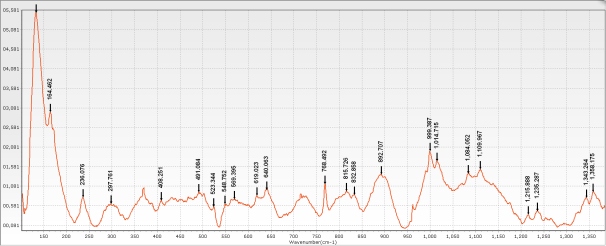
| Sample No. | 2 | 4 | 6 | 9 | 14 | 35 | 39 | 40 | 43 | 49 |
|---|---|---|---|---|---|---|---|---|---|---|
| h₁/h₂ | 0.918 | 0.597 | 0.939 | 0.572 | 0.667 | 1.170 | 0.867 | 0.856 | 0.775 | 0.718 |
(Note: h₁ = Peak height at 232 cm⁻¹, h₂ = Peak height at 369 cm⁻¹)
3. Conclusion
In this study, 70 thermal paper samples were tested and analyzed using a confocal laser Raman spectrometer. The samples were categorized based on their filler compositions. Further distinctions were made within each category using relative peak height ratios.
This method is simple, fast, accurate, and reliable. It consumes minimal material, does not damage the sample, and is suitable for analyzing physical evidence extracted from crime scenes involving thermal paper.
References
-
Li Hui, Li Yuming. Specialty Technical Papers—Thermal Paper [J]. Paper and Paper Making, 2003(5): 60-61.
-
Zhang Hong, Feng Jimin, Yong Pan, et al. Study on Infrared Spectroscopy for Testing Thermal Paper [J]. China Thesis, 2013(2): 12-17.
-
Zhang Hong, Wang Ping, Tao Keming, et al. Research on SEM/EDS for the Examination of Thermal Paper [J]. China Thesis, 2016(22): 53-55.
-
Li Jinhua, Zhang Lei, Chen Danchao. Determination of BPA in Thermal Paper by HPLC [J]. Physicochemical Testing (Chemical Abstracts), 2013(9): 1070-1072.
-
Buzzini P, Suzuki E. Forensic Application of Raman Spectroscopy in the On-Site Analysis of Pigments and Dyes in Inks and Paints [J]. Journal of Raman Spectroscopy, 2015, 47(1): 16-27.
-
Doty KC, Muro CK, Bueno J, et al. What Can Raman Spectroscopy Do for Criminology? [J]. Journal of Raman Spectroscopy, 2015, 47(1).
-
Guo Feng, Zhang Hong. Study on Raman Spectroscopy for Testing Cigarette Liner Paper [J]. China Thesis, 2016(12): 53-58.
-
Luo Liubin. Study on the Cell Wall Changes in Tea Under Maoyemarum Disease Infection Based on Confocal Raman Spectroscopy [D]. Zhejiang University, 2015.
-
Li Sheng, Dai Liankui. A Simple Online Raman Spectroscopy Spike Curling Method [J]. Journal of Optical Scattering, 2011(3): 188-194.