0
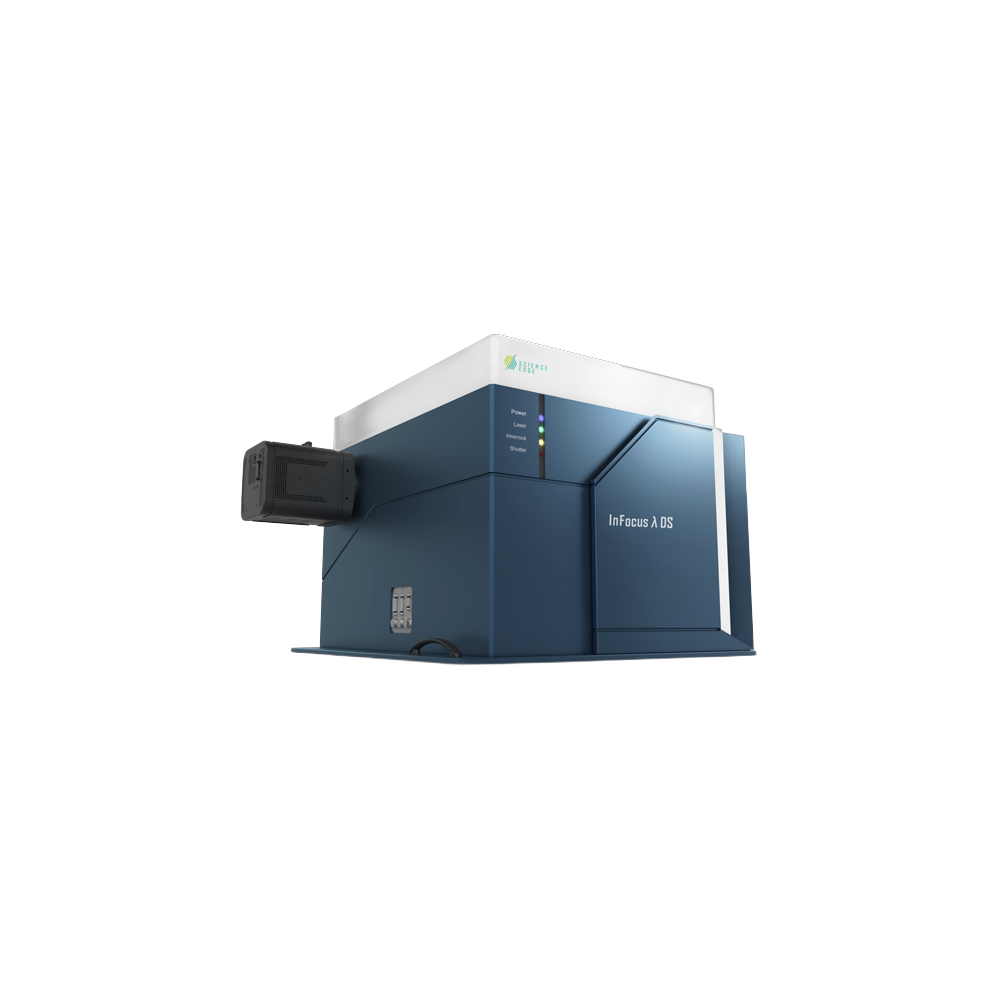
ScienceEdge InFocus λ DS 암시야 분광 이미징 현미경 Dark-field Microscope
Ultra-fast dark-field hyperspectral imaging microscope with line detection
라인 검출 초고속 암시야 초분광 이미징 현미경
Description
The InFocus λ DS merges dark-field microscopy with hyperspectral imaging, enabling observation of metal-nanoparticle distributions and spectral analysis of their scattering and fluorescence. Epi-illumination dark-field optics (ring diaphragm and ring mirror) remove background light, while line detection with a 256 × 1024 electrically-cooled CCD delivers ultra-fast, high-definition spectroscopic imaging — invaluable for plasmonic biosensor research.
InFocus λ DS는 암시야 현미경과 초분광 이미징을 결합한 장비로, 금속 나노입자 분포 관찰과 산란·형광의 분광 분석을 동시에 수행합니다. 링 조리개와 링 미러 기반 낙사 암시야 광학계가 배경광을 제거하고, 256 × 1024 전자냉각 CCD의 라인 검출로 초고속·고정세 분광 이미징을 구현하여 플라즈모닉 바이오센서 연구에 활용됩니다.
Key Features
- Simultaneous dark-field observation and hyperspectral spectroscopy
- 암시야 관찰과 초분광 분광 동시 수행
- Line detection: 256 spatial points measured spectroscopically at once for high speed
- 라인 검출: 256개 공간점 동시 분광 측정으로 고속화
- Electrically-cooled CCD, 256 × 1024 pixels
- 전자냉각 CCD 256 × 1024 픽셀
- Four ROI modes (point, line, square, ellipse) for noise-minimized spectra
- 4가지 ROI 모드(점·선·사각·타원)로 노이즈 최소화 스펙트럼
- Particle analysis: automatic detection, counting and per-particle spectra
- 입자 분석: 자동 검출·계수·입자별 스펙트럼 추출
Applications
- Plasmonic biosensor R&D
- 플라즈모닉 바이오센서 연구개발
- Scattering & fluorescence analysis of metal nanoparticles
- 금속 나노입자 산란·형광 분석
- Surface-plasmon-enhanced optical response evaluation
- 표면 플라즈몬 증강 광응답 평가
- Nanostructure distribution imaging on flat substrates
- 평면 기판 위 나노구조 분포 이미징
Specifications
| Parameter | Specification |
|---|---|
| Technique | Dark-field spectroscopic (hyperspectral) imaging microscopy |
| Illumination | Epi-illumination dark-field (ring diaphragm + ring mirror, white LED) |
| Detector | Electrically-cooled CCD, 256 × 1024 pixels |
| Acquisition | Line detection – 256 spatial points measured spectroscopically at once |
| ROI modes | Point, Line, Square, Ellipse |
| Analysis | Particle detection, counting & numbering, per-particle averaged spectra |
| Display | Pseudo-color band mapping, average / peak-area (Covell method) intensity |